Visualizing Graphs in Haskell
Dependency graphs are everywhere in computing: Database tables have foreign key relationships with each other, programming languages have functions that call each other, and filesystems have folders containing folders and files.
This article will show how you how to:
- Construct a graph by reading folders and files from disk
- Render the graph into a .dot file
- Render the .dot file into an image
The graphviz package is available here, and the final code is available on Github.
Constructing the Graph
A graph is usually described as a collection of vertices and a collection of edges that connect two vertices:
type V = [a]
type E = [(a,a)]
type Graph = ([V], [E])
graphviz extends this with labels that provide additional information when rendering, and clusters that describe how to group vertices together.
We’ll want both types of labels when we construct our filesystem graph, because we’ll color them differently:
- Vertex label: Is the file a directory, symlink, or file?
- Edge label: Is the link a hard link between e.g. a folder and its contained files, or a symbolic link?
Here are our types:
data VLabel = VLDirectory
            | VLSymlink
            | VLFile
type V = (Filepath, VLabel)

data ELabel = ELHardlink
            | ELSymlink
type E = (Filepath, Filepath, ELabel)

type FileGraph = ([V], [E])
Here’s how you can traverse the directory structure:
import System.FilePath.Posix
import System.Directory
import System.IO

readDirectoryGraph :: FilePath -> IO FileGraph
readDirectoryGraph root = do
  isSymlink <- pathIsSymbolicLink root
  if isSymlink
    then onSymlink
    else do
      isFile <- doesFileExist root
      if isFile
        then onFile
        else onDirectory
  where
    onSymlink :: IO FileGraph
    onSymlink = do
      target <- normalise <$> getSymbolicLinkTarget root
      return ([(root, VLSymlink)], [(root, target, ELSymlink)])

    onFile :: IO FileGraph
    onFile = do
      return ([(normalise root, VLFile)], [])

    onDirectory :: IO FileGraph
    onDirectory = do
      children <- map (\x -> root ++ "/" ++ x) <$> listDirectory root :: IO [FilePath]
      subgraphs <- mapM readDirectoryGraph children :: IO [FileGraph]
      let v = (normalise root, VLDirectory) :: V
          es = map (\x -> (normalise root, x, ELHardlink)) children :: [E]
          childVertices = concatMap fst subgraphs :: [V]
          childEdges = concatMap snd subgraphs :: [E]
      return (v:childVertices, es ++ childEdges)
The output of readDirectoryGraph are application-specific Haskell values. We haven’t yet used anything from graphviz.
Rendering the Graph
When we render the graph, we’ll want to set different colors for files, symlinks, and directories. Here’s how we can do that with the labels we saved during the traversal:
import qualified Data.GraphViz as G
import qualified Data.GraphViz.Attributes.Complete as G
import qualified Data.GraphViz.Types as G

-- GraphVisParams vertexType vertexLabeltype edgeLabelType clusterType clusterLabelType
fileGraphParams :: G.GraphvizParams FilePath VLabel ELabel () VLabel
fileGraphParams = G.defaultParams {
  G.fmtNode = \(v, vl) -> case vl of
      VLDirectory -> colorAttribute $ G.RGB 0 0 0
      VLSymlink   -> colorAttribute $ G.RGB 40 255 40
      VLFile      -> colorAttribute $ G.RGB 255 40 40,
  G.fmtEdge = \(from, to, el) -> case el of
      ELHardlink -> colorAttribute $ G.RGB 0 0 0
      ELSymlink  -> colorAttribute $ G.RGB 40 255 40
      }
  where
    colorAttribute color = [ G.Color $ G.toColorList [ color ] ]
Now we’ll tie everything together:
main :: IO ()
main = do
  -- 1. Create our application-specific graph
  (vs, es) <- readDirectoryGraph rootDir
  -- 2. Convert it into a DotGraph
  let dotGraph = G.graphElemsToDot fileGraphParams vs es :: G.DotGraph FilePath
  -- 3. Render it into .dot text
      dotText = G.printDotGraph dotGraph :: TL.Text
  -- 4. Write the contents to a file
  TL.writeFile "files.dot" dotText
This can be rendered into an image using the dot command from the graphviz package that your OS’ package manager likely carries:
dot files.dot -Tpng > files.pngAnd here’s the final result:
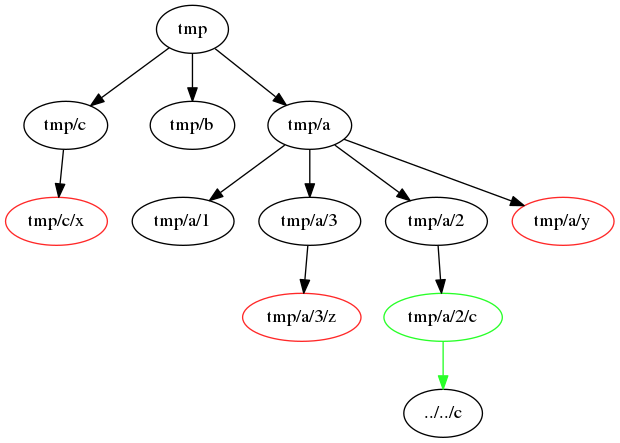
This is the corresponding directory structure:
$ find tmp
tmp
tmp/c
tmp/c/x
tmp/b
tmp/a
tmp/a/1
tmp/a/3
tmp/a/3/z
tmp/a/2
tmp/a/2/c
tmp/a/y
The graphviz package isn’t too difficult to use, but I feel like it could use a few examples. Hopefully this helps someone trying to render a graph.